南海所在pH响应型活性包装膜实现海洋鱼类新鲜度监测与腥味靶向控制方面研究取得新进展
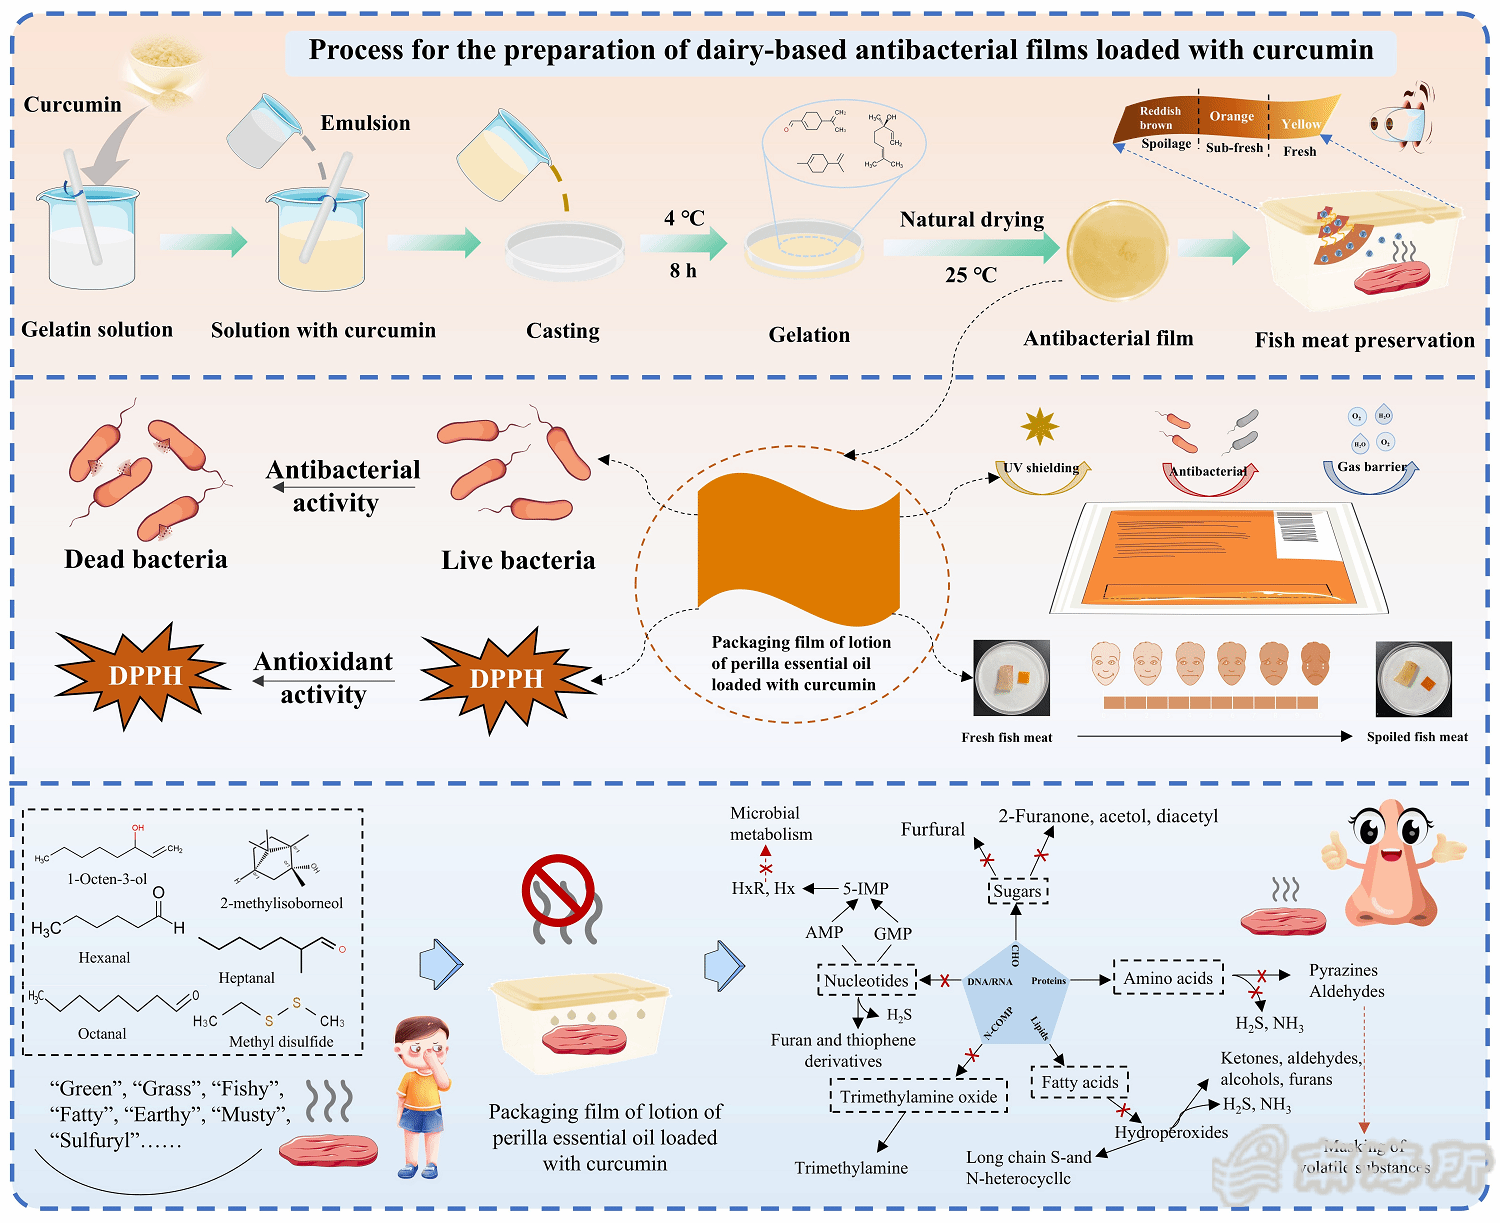
近日,中国水产科学研究院南海水产研究所院级水产品精深加工与高值化利用创新团队在国际工程类Top期刊《Carbohydrate Polymers》(Q1,中科院一区TOP,IF=12.5)上发表题为《Chitosan‑titanium dioxide emulsion incorporated pH-responsive active packaging film: Real-time freshness monitoring and targeted fishy odor control》的研究性论文。论文第一作者为联合培养研究生吴亚梅,通讯作者为南海所王悦齐研究员、吴燕燕研究员。
海洋食品在贮藏过程中容易发生品质劣变,导致营养价值和商业价值下降,同时微生物过度繁殖也会增加食源性疾病风险,对人体健康构成威胁。传统塑料包装难以提供抗菌、抗氧化和紫外防护等功能,且不可生物降解,既不利于环境保护,也无法满足现代水产品保鲜的需求。因此,开发环境友好、可持续,并能够有效减少水分流失、抑制氧化和微生物生长的包装材料,已成为当前的研究热点。天然生物聚合物因其良好的成膜性、安全性和生物可降解性,被广泛视作理想替代材料,然而现有生物基包装仍存在活性成分易挥发、水溶性差导致功能不稳定等问题,同时缺乏对产品新鲜度的实时可视化监测能力,难以实现水产品保鲜与安全预警一体化。
针对上述产业技术瓶颈,研究团队以生物相容性优异、成膜性良好的明胶为基材,将姜黄素负载到CS-TiO₂乳液的明胶基膜中,赋予膜pH响应智能监测功能,构建了集活性保鲜-智能监测-环境友好于一体的水产品智能包装膜。该薄膜具备灵敏可逆的pH响应行为,可对鱼类腐败进程进行实时、可视化监测的能力,有效抑制了海洋鱼类优势腐败菌的增殖,为海洋食品绿色环保型高性能智能包装的开发提供了创新策略与理论技术支撑。
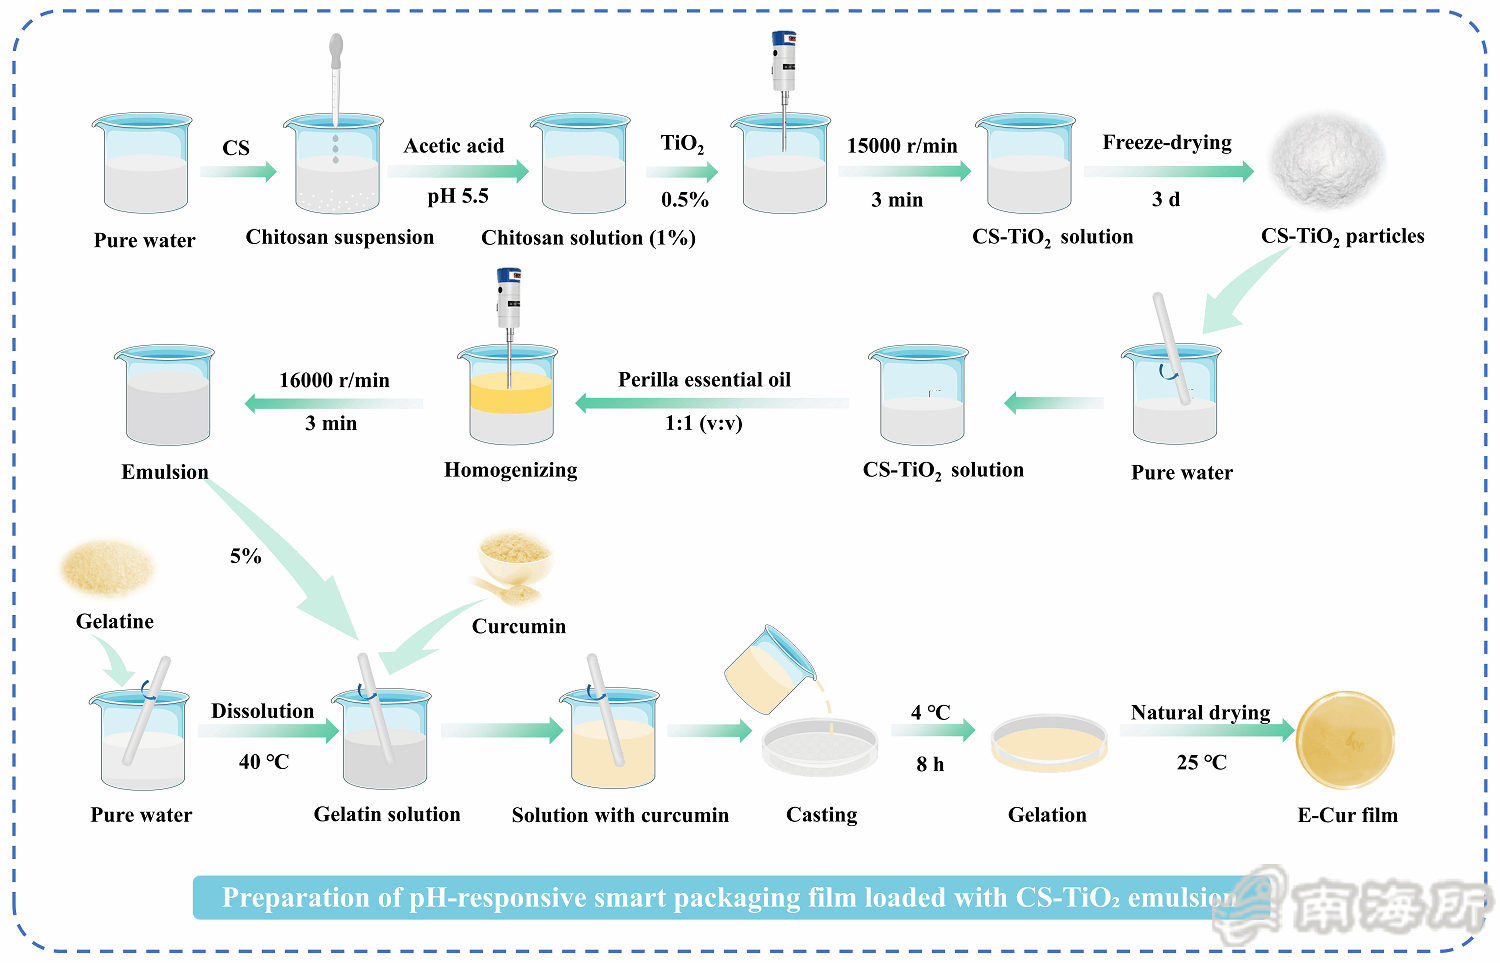
Fig. 1 Schematic diagram of the preparation process of pH-responsive smart packaging film loaded with CS-TiO₂ emulsion.
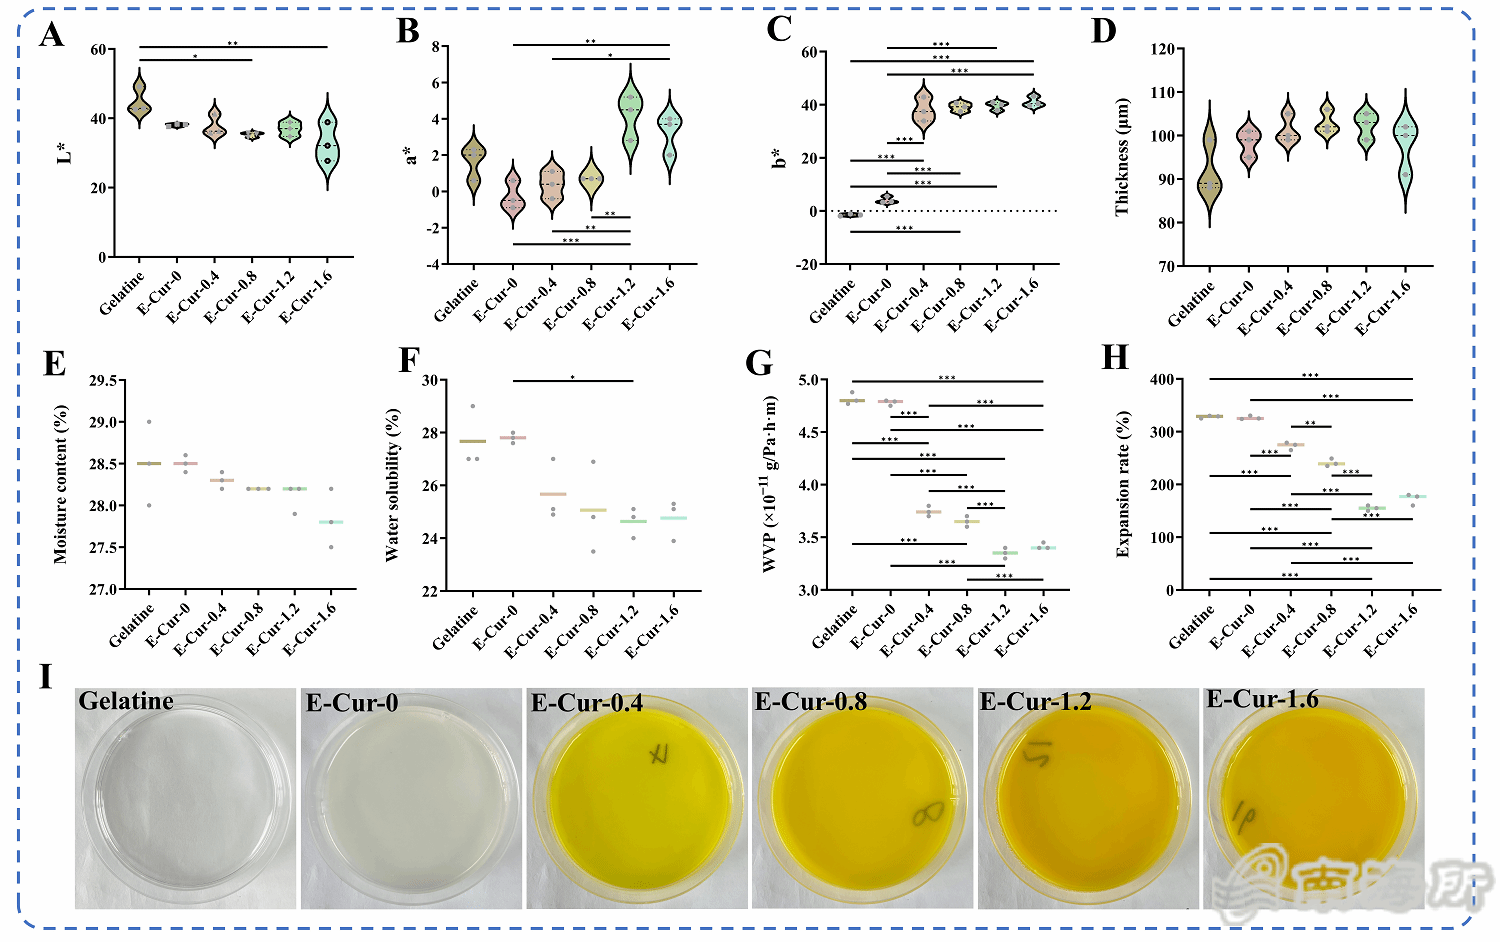
Fig. 2 Color parameters L* value (A), a* value (B), b* value (C), thickness (D), moisture content (E), water solubility (F), water vapor permeability (G), swelling rate (H), and digital image (I) of E-Cur
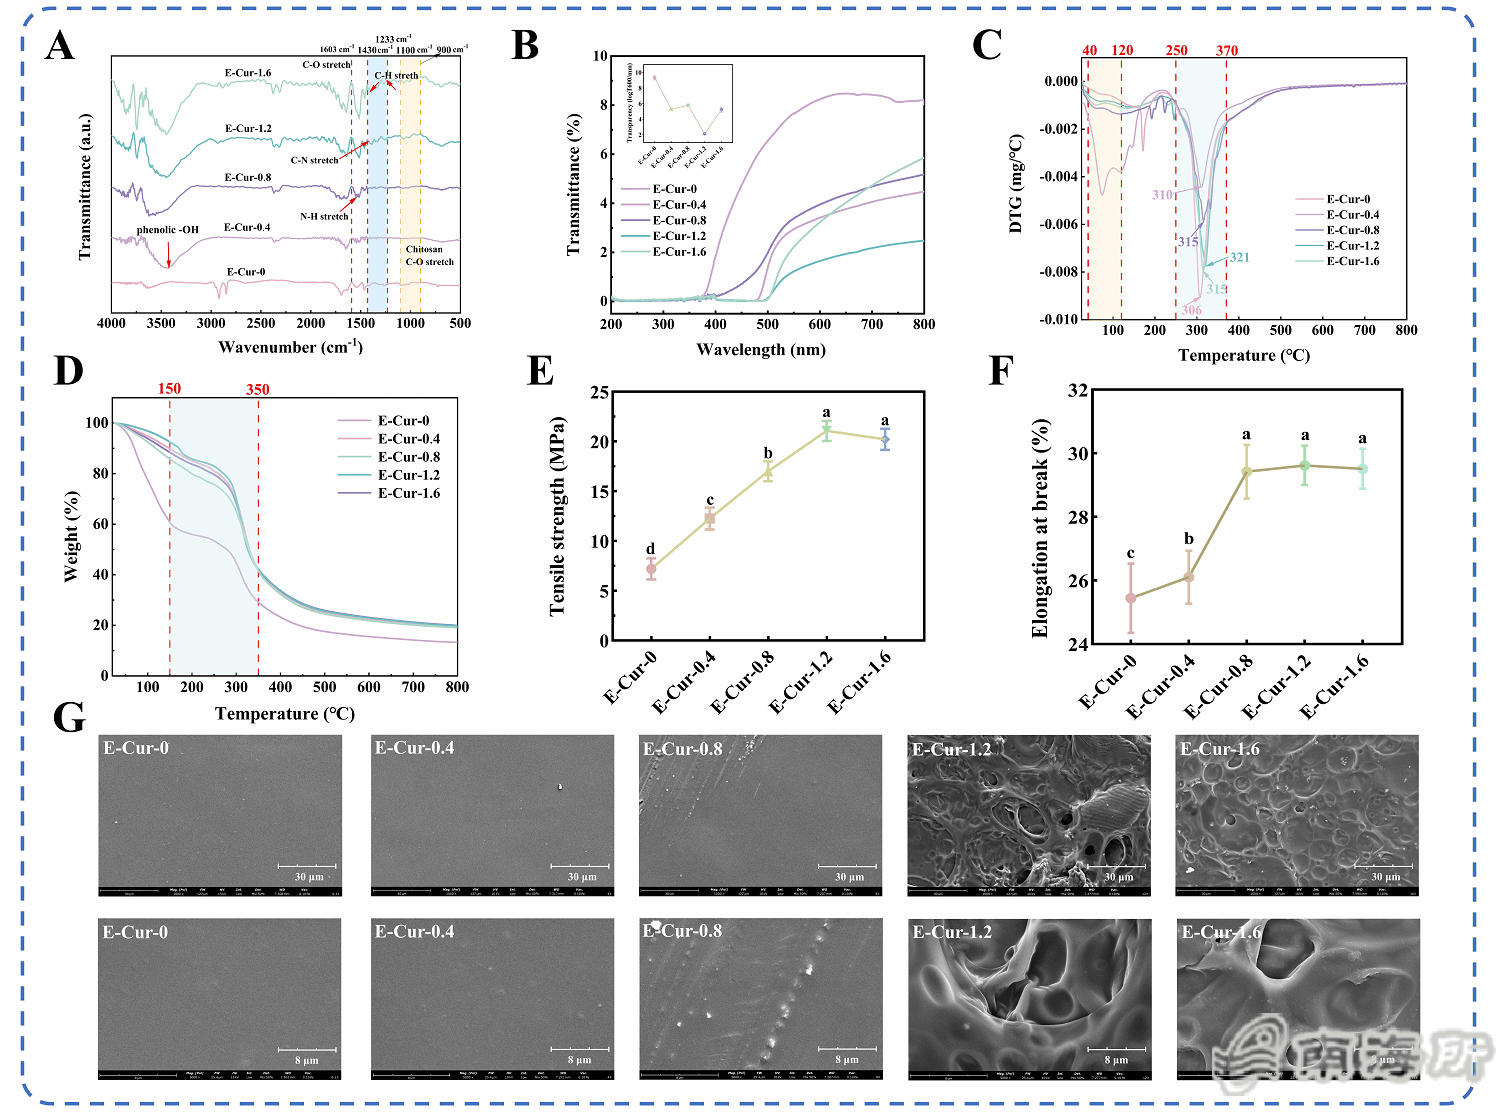
Fig. 3 FTIR spectrum (A), UV spectrum and transmittance (B), DTG curve (C), TGA curve (D), tensile strength (E), elongation at break (F), and surface microstructure (G) of E-Cur film.
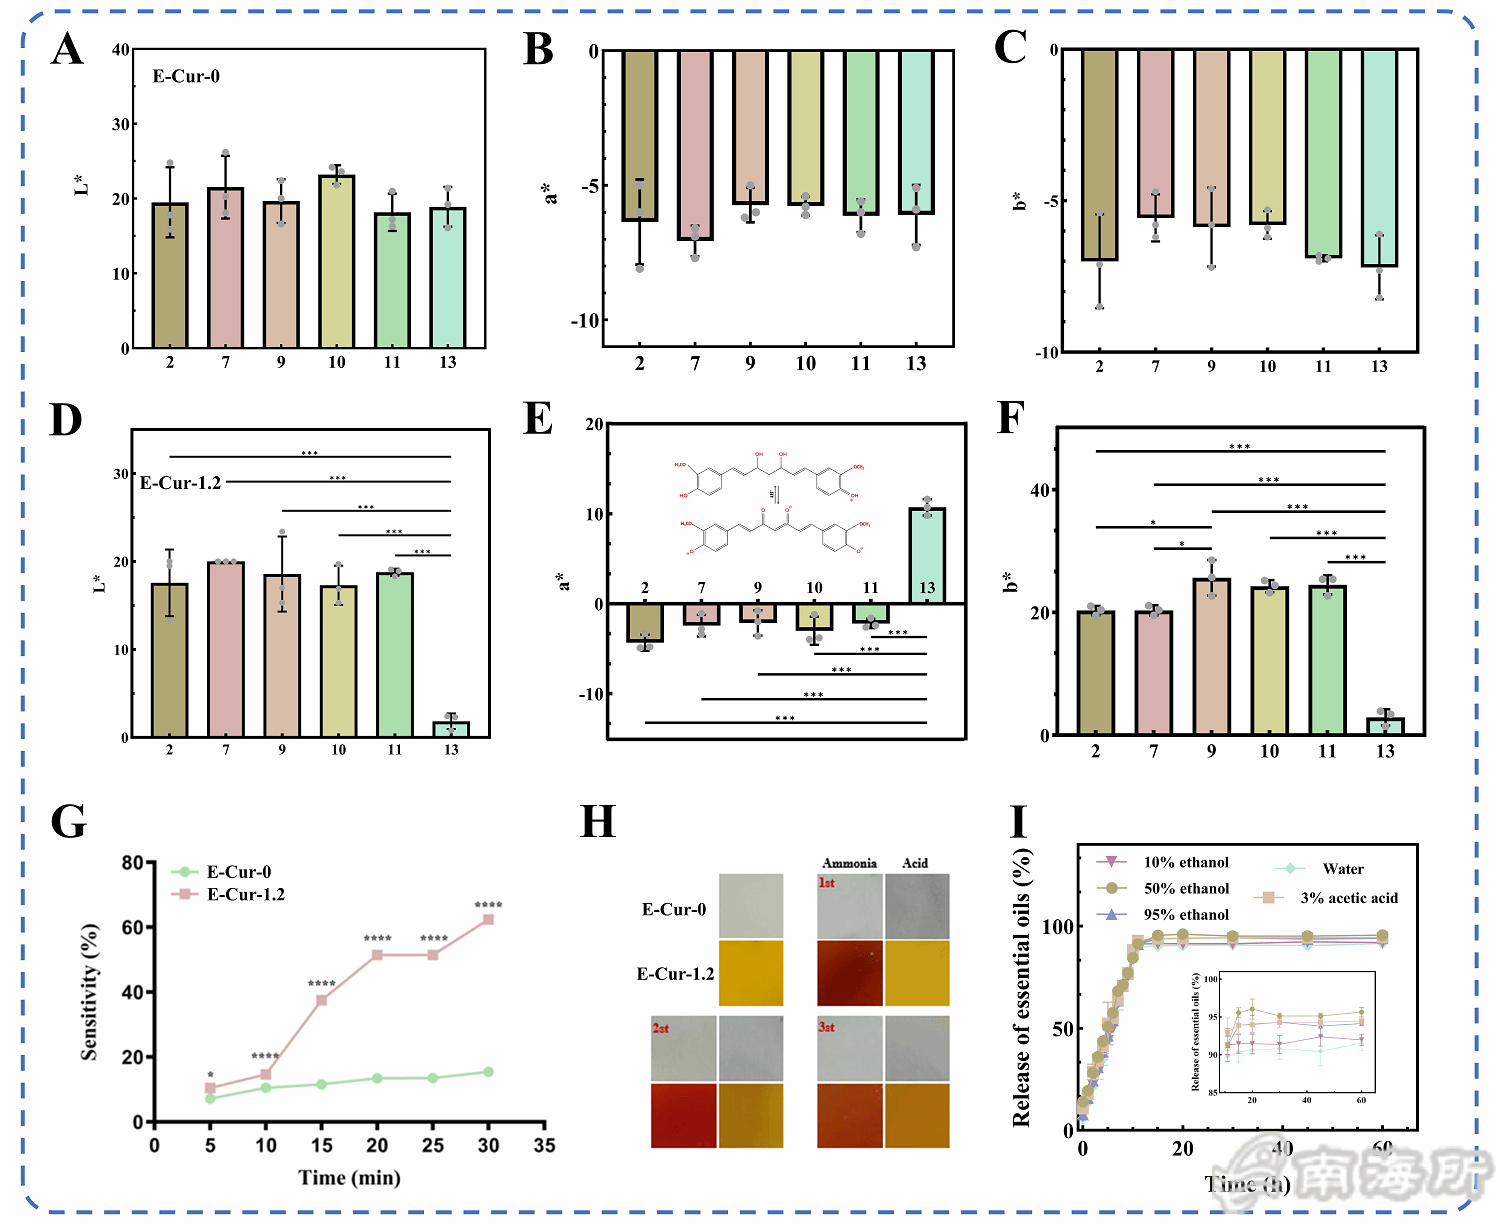
Fig. 4 Color parameters of E-Cur-0: L* value (A), a* values (B), b* values (C), and color parameters of E-Cur-1.2: L* values (D), a* values (E), b* values (F) under different pH conditions, sensitivity to ammonia vapor (G) and color reversibility (H) of E-Cur film, and evaporation of essential oils in different simulated solutions (I).
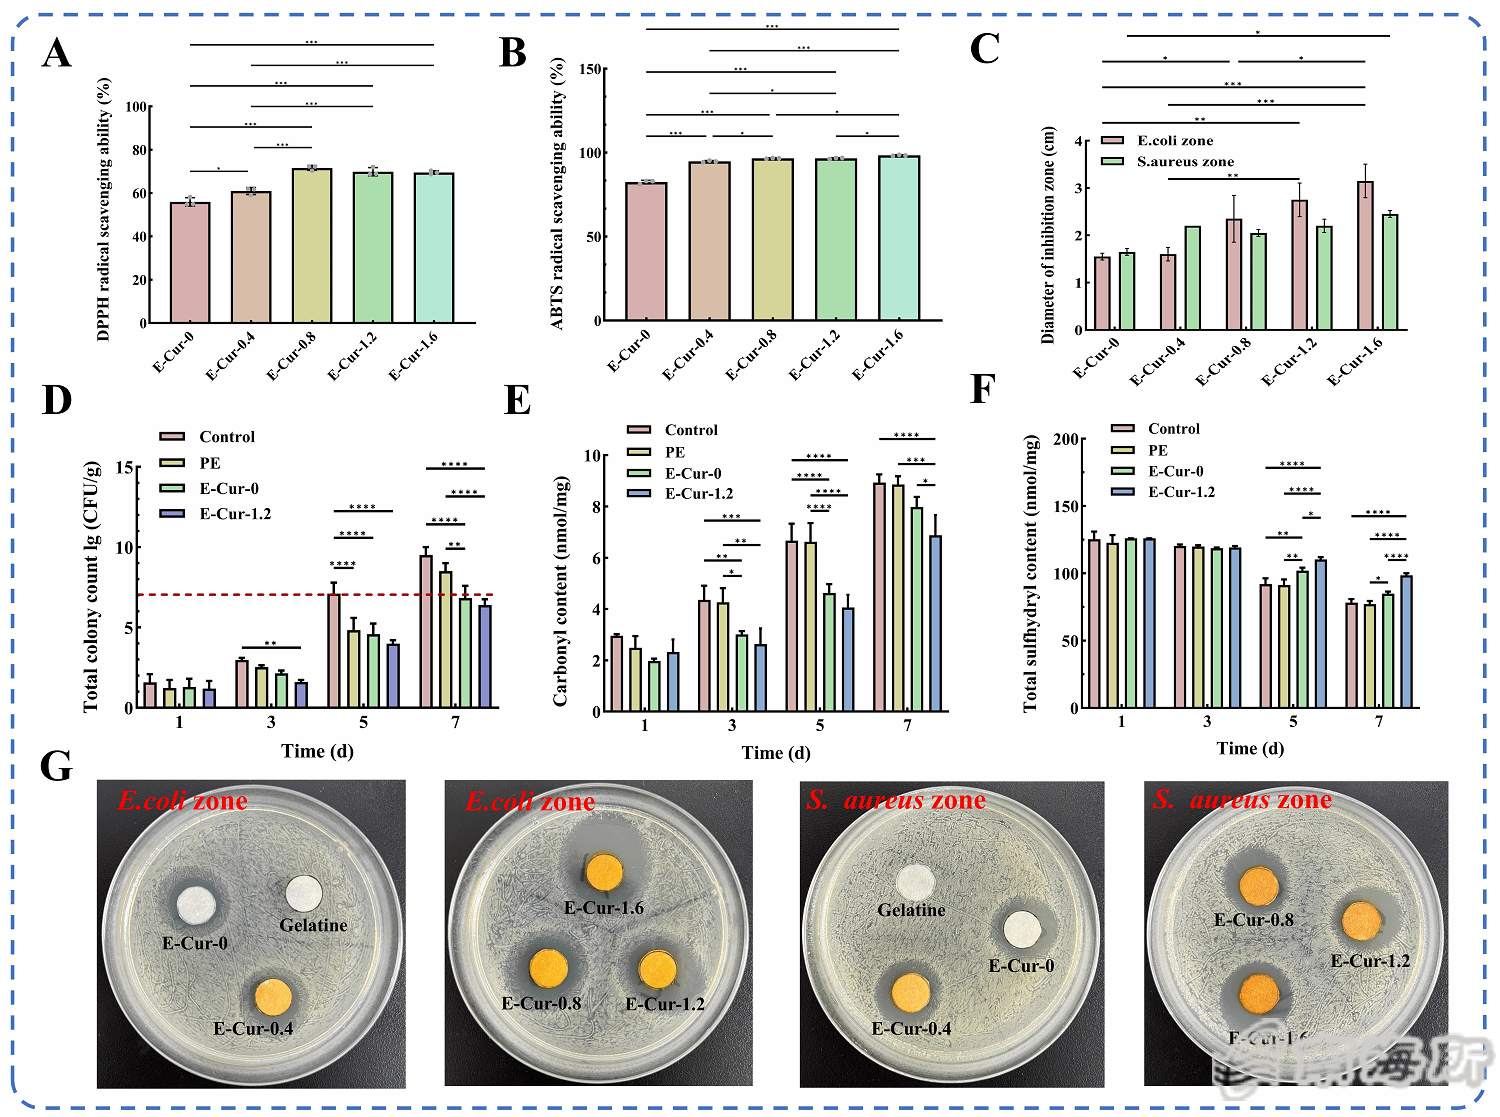
Fig. 5 DPPH radical scavenging rate (A), ABTS radical scavenging rate (B), and antibacterial zone diameter (C) of E-Cur film, total viable cell count (D), carbonyl content (E), and total sulfhydryl content (F) of fish meat at different storage days, and antibacterial zone (G) of E-Cur film.
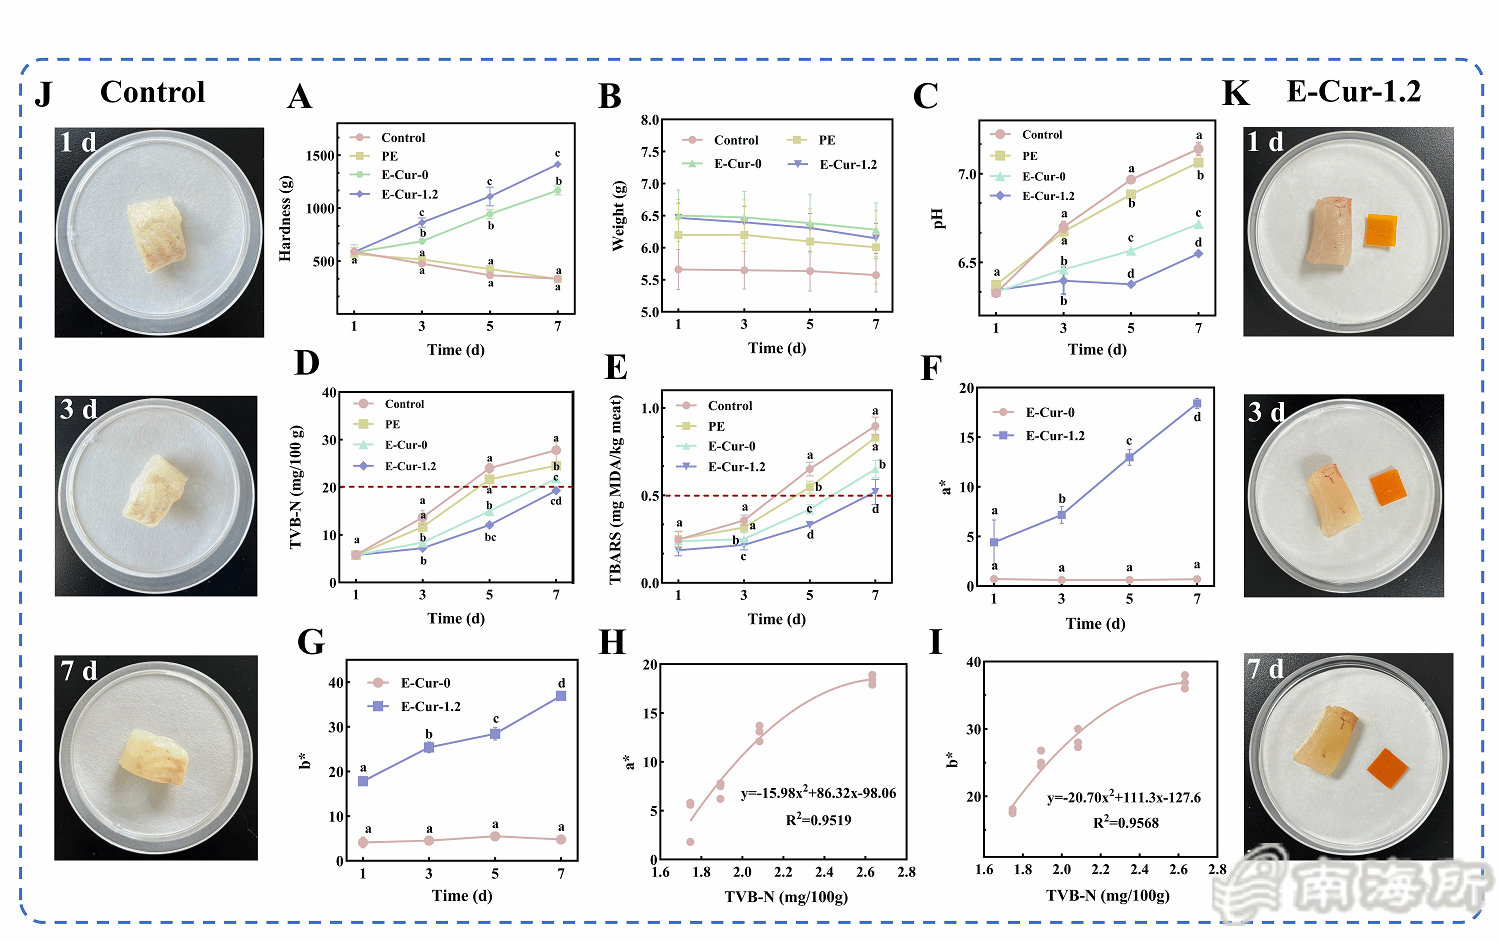
Fig. 6 Hardness (A), weight (B), pH value (C), TVB-N (D), TBARS content (E) of fish fillets at different storage days, color parameters a* value (F) and b* value (G) of the E-Cur film during storage, linear relationship between TVB-N and a* value (H), linear relationship between TVB-N and b* value (I), visual representation of fish fillets in the control group (J) and E-Cur-1.2 group (K) at different storage days.

Fig. 7 Chord diagrams of relative abundance of bacterial colonies in fish fillets from the E-Cur-1.2 group (A) and the control group (B) at different storage days at the phylum level, relative abundance bar chart of fish fillets at different storage days at the phylum level (C), chord diagrams of relative abundance of bacterial colonies in fish fillets from the E-Cur-1.2 group (D) and the control group (E) at different storage days at the genus level, relative abundance bar chart of fish fillets at different storage days at the genus level (F), volatile compounds of fish fillets at different storage days (G), and correlation analysis (H).
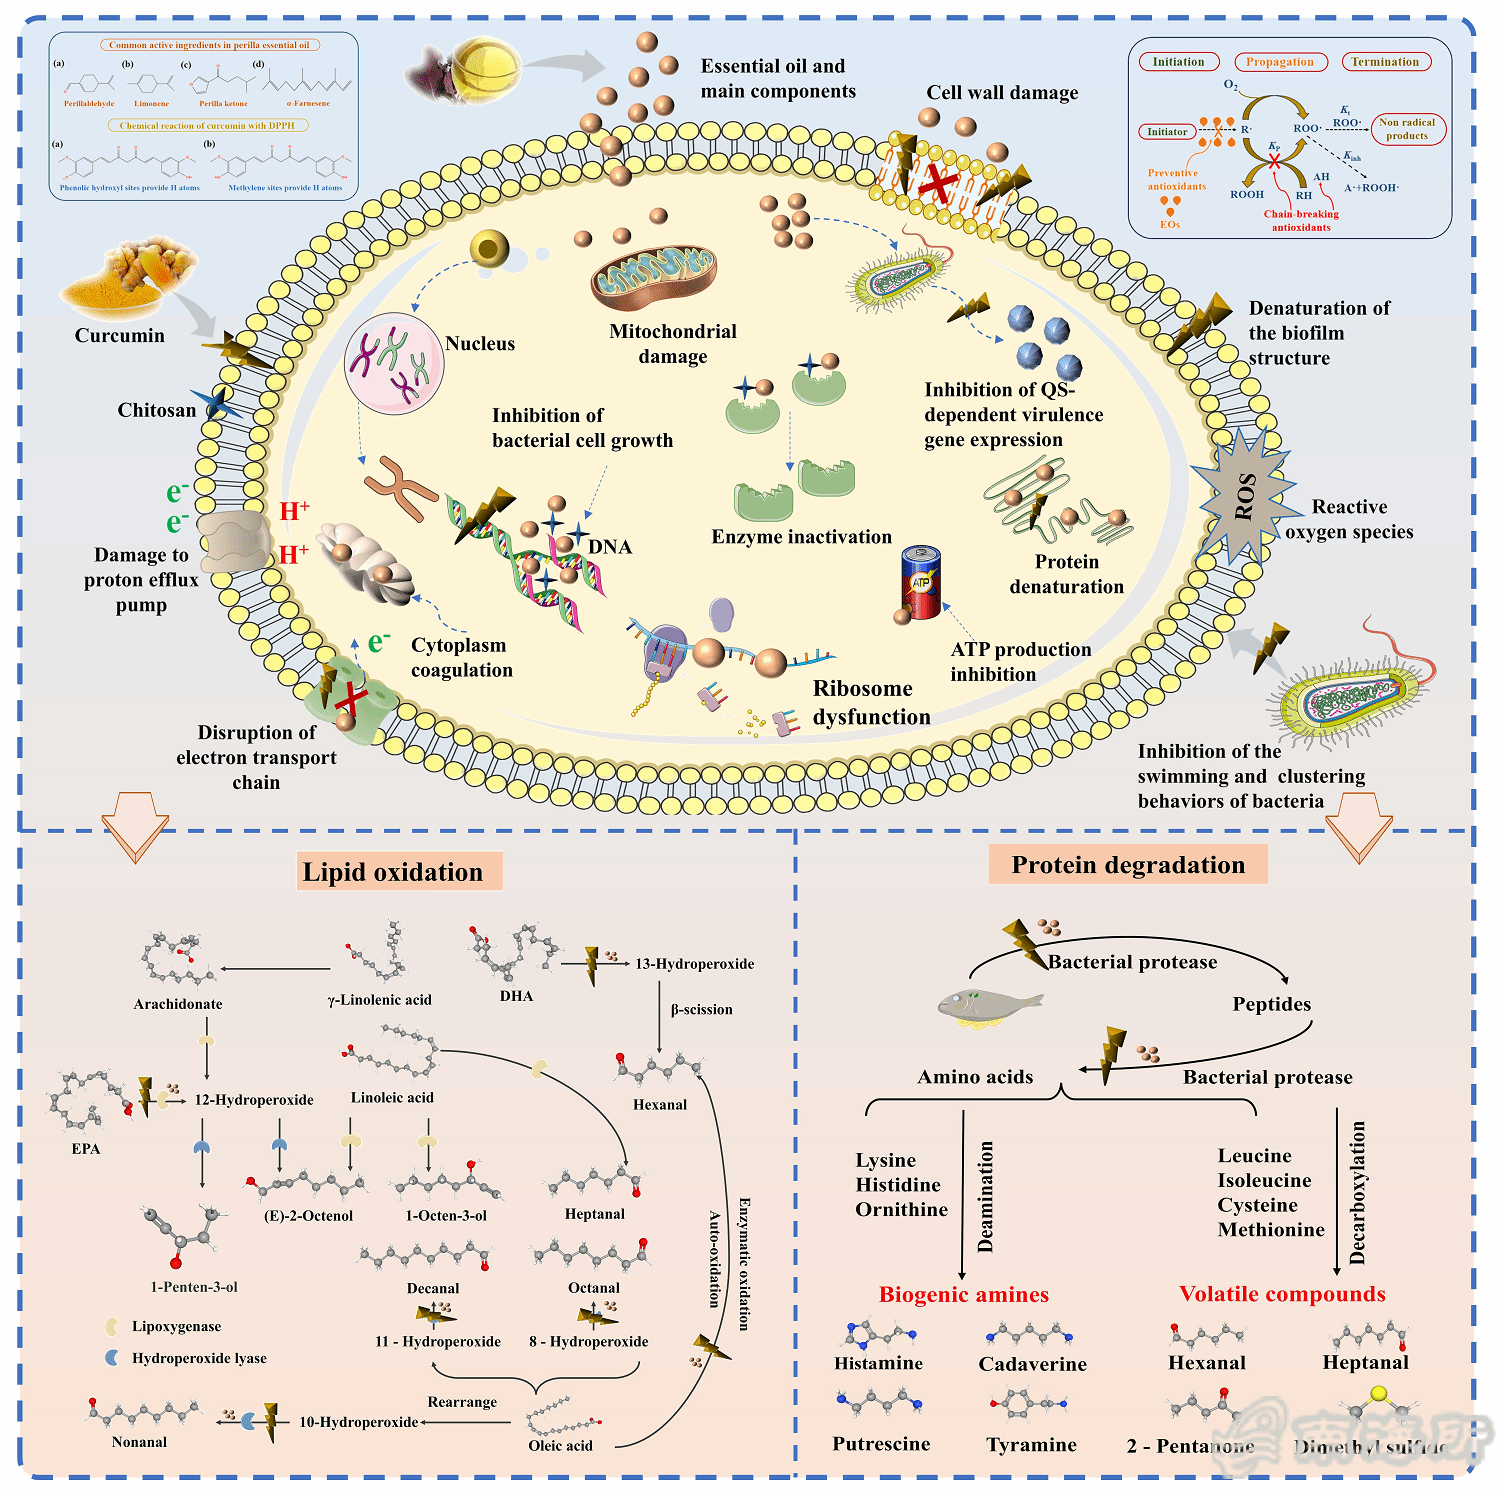
Fig. 8 Potential effects analysis of the antibacterial and deodorizing effects of pH-responsive smart packaging film loaded with CS-TiO₂ emulsion.
原文链接:https://doi.org/10.1016/j.carbpol.2025.124317
分享到朋友圈


 粤公网安备44010502001742号